Hey hey! 2 posts in one week with pie charts derived from excel! I guess this is the week for digging into data!
I love reading other's summaries of their spending and feel like more and more share a summary of their spending on a monthly, quarterly, or annual basis. I have chosen to share it on an annual basis and I stick to percentages. We use Mint to track our spending, although my active use of it has been at an all-time low this past year! Between work and parenting, I just don't think to track it, so putting together this annual summary was more time consuming than it had been in the past because I had to fix a lot of things that were incorrectly categorized.
Some disclaimers up front:
1. This chart does not include savings or contributions to things like 529s, 401ks, brokerage accounts, etc.
2. I took taxes out of the calculation this year. It just really throws things off and we do not have any control over how much we pay in taxes. And we pay A LOT. I've commented in years past about how much our tax obligation has changed since getting married... even with claiming 0 allowances, we still end up needing to make extra payments, and then owe money when we file taxes. Anyways, I'm not complaining about the amount of taxes we pay. We are fortunate to work in well-compensated industries. We live in a great city with great parks/running paths and libraries that we take advantage of every week, great schools, and a host of other benefits. But taking taxes out of the equation going forward seemed to make sense since nothing we can do is really going to change the amount of taxes we pay.
3. This spending summary finally includes all of Phil's spending. It took until mid-2020 to get him onboard with using mint, but now he's a fan. It has made our quarterly financial reviews way easier since all of our account balances are summarized there. And it has prevented him from seeing the balance on a credit card bill and asking what I bought. Now he can just look at mint and solve the mystery on his own. Ha.
So here goes! 2021 spending, in a nutshell. Get comfortable, this is a lengthy post!!
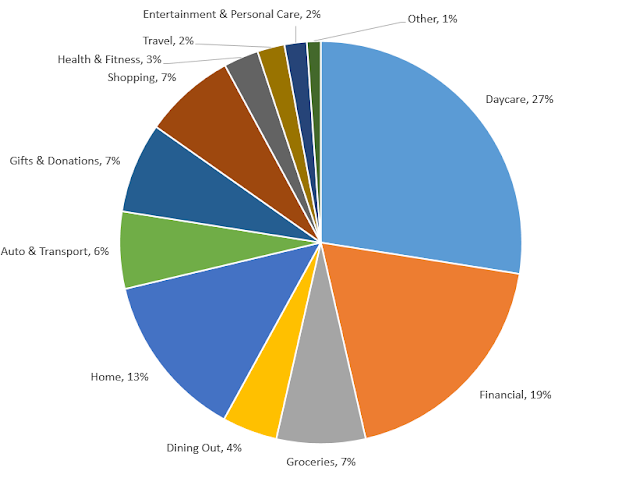
Daycare (27%): Surprise, surprise. Daycare is our biggest expense category. But they earn that money, and then some. We are very happy with our daycare and while I know our kids get way more illnesses from being in a daycare center setting, overall it works for our family. In 2 years, Paul will be done with daycare, although surely it will be somewhat replaced by a before/after care program at the public school. So a pretty significant amount of our spending will go to daycare/child care for the foreseeable future.
Financial (19%): This category includes the purchase of equity in my husband's firm. I think I left this out previously but decided to keep it in. He receives quarterly dividends so it's been a good investment for us.
Home (13%): So this category is probably surprisingly small to many. It includes home furnishing expenses and utilities. The big ticket items in 2021 were purchasing patio furniture and the 50% down payment on converting our wood-burning fireplace to gas. Long-time readers of the blog may remember that we paid off our house in 2020, so this category is a small fraction of what it was in 2020. Again, I know it is not typical to pay off your mortgage at age 40 and we feel very lucky to have been able to do that, but we are also a very frugal couple. Sometimes people will ask us why we did that instead of investing the money and the answer is that we really value having absolutely no debt. We both work in a really volatile industry so our jobs are not very stable/safe, and we have no diversification of income since we both work in the same industry (we work for asset managers). So our jobs are pretty much entirely exposed to financial markets, and then our investments are completely exposed to financial markets. So we make the decision about investing v paying off debt differently than we might have if we worked in different industries.
Our spending in this category also decreased because we no longer have a house cleaner. We had one for about half of 2020 when it felt safe enough to have people in our house up until a month before Will was born. But Phil asked that we not re-hire them and instead he does the cleaning. If it was up to me, I'd re-hire them because they do an amazing job, but it's one of those "pick your battles" type of situations. I'm just glad Phil is taking on the cleaning because my MO was: we re-hire them or you do it... That probably sounds kind of, well, cut throat? But I think hiring cleaners is a good use of money. I like having a clean house but I do not enjoy cleaning whatsoever! Phil doesn't love cleaning but would rather clean our house than spend money on a house cleaner.
Groceries (7%): Our grocery spending increased by about 5% over the previous year, but that was missing months of Phil's credit cards, so overall we probably spent about the same or maybe a little less? The year-over-year comparisons will more accurate going forward.
Shopping (7%): This is mainly Target and Amazon Prime purchases. In 2020 I would go into mint and categorize those purchases but I gave up on that in 2021. Surely a lot of what we purchased at both stores would fall under household goods and kids stuff. But it's not worth the effort of categorizing the embarrassing number of line items. Yes, I know Amazon is a problematic company but in this stage of life where it's hard to get out and run errands, I've accepted that we are going to get a lot of packages from Amazon Prime. When possible, I shop local, like for books - I buy so few that I always buy from an independent book store. But right now, I need toilet paper and compost bin liners, etc, to automatically show up on my door.
Gifts & Donations (7%): This is 70% donations, 30% gifts. The donations bucket is higher than past years because my company stopped taking charitable contributions out of my paycheck in 2021 (which I didn't manually add to past spending summaries), but I did not realize that until November 2021... But I partially made up for the donations I would have automatically made to United Way by contributing a chunk in November. In 2022 I plan to set up recurring donations with them. Giving to charity is something that is really important to me since I recognize how incredibly lucky we are to be in the financial situation we are in. Besides United Way, I donate to our county library and a few other local charities.
Auto & Transport (6%): Nothing very interesting here - it's car insurance, parking and gas. This spending category is higher than is was pre-covid since we used to both take the bus. But we still drive very little. Phil's 2013 Corolla has 25k miles on it and my 2016 Camry has 30k miles on it. Which is very low! Hopefully this spending category increases next year - we are hoping to buy a Rav4 Prime when one becomes available near us. A Rav4 Prime is a hybrid that 100% uses a battery for trips until 50 miles or something like that? Which is 90% of our driving.
Dining out (4%): I think I had 2-3 restaurant meals this year - 2 eaten outdoors, 1 was in a covered patio. So the bulk of this spending is Phil's lunches when he goes into the office, take-out, coffee shops, and alcohol (which is a pretty small percentage of the spending - it's Phil's maybe monthly/every other month craft beer purchase and the occasional bottle of wine for me). My coffee shop spending was 1/2 of the 2020 level, though! But I bought a venti whole milk vanilla latte every day during the last trimester of pregnancy since it was one of the few "treats" I could have on a gestational diabetes diet. This year my latte purchases are fewer and far between, but I will usually get one when I do daycare drop-off, which is pretty rare.
This category is an example of our frugality. Even when there isn't a pandemic and even before we had kids, we did not spend a lot on meals out. We are both home bodies and with my gluten intolerance, eating out just isn't something we do all that often. But I have very much enjoyed getting take-out on about a monthly basis this past year. This category is very much a "you do you." If eating out brought us more joy, we'd do it more often. But between the pandemic and having kids, it's not something we are looking to do much of.
Travel (2%): I'm excited to have a travel line after not having one in 2020! We did take one trip in February 2020 before the pandemic hit, but we had paid for our tickets and accommodations in 2019, so we didn't spend any money on travel in 2020. Our 2021 spending was plane tickets for our Feb 2022 trip to Arizona to visit my sister! I hope and pray this trip will happen. And it will as long as we don't get covid in the week or so leading up to that trip! Fingers crossed we stay healthy!
***
So there you have it! Overall, these finance posts feel similar to the time-tracking post I wrote earlier this week. Nothing is terribly surprising to me, and I don't know that I would change anything after putting this post together. But it's interesting to see what our spending pie chart looks like, especially in contrast to others!
Do you do a similar exercise and look at your spending on a regular basis? Besides putting this post together every year, Phil and I have a quarterly financial review that is focused on our investments and what charities we'd like to donate to.


